
Get started
First run
The setup wizard takes you from an empty container to your first overview. This page shows what each step asks and what happens behind it.
Open http://localhost:5180. With no tenant connected yet, the app starts the wizard. You can leave it at any point; it picks up where you stopped. Use Add tenant in the sidebar to run it again for another tenant.
-
Welcome
What the app does and how it treats your data: what it collects stays in your data volume, there is no backend, and sign-in tokens stay in memory.
Explore with demo data opens the app with sample rules from a public rule repository and synthetic incident numbers, clearly marked as demo. Useful to look around before you register an app.
-
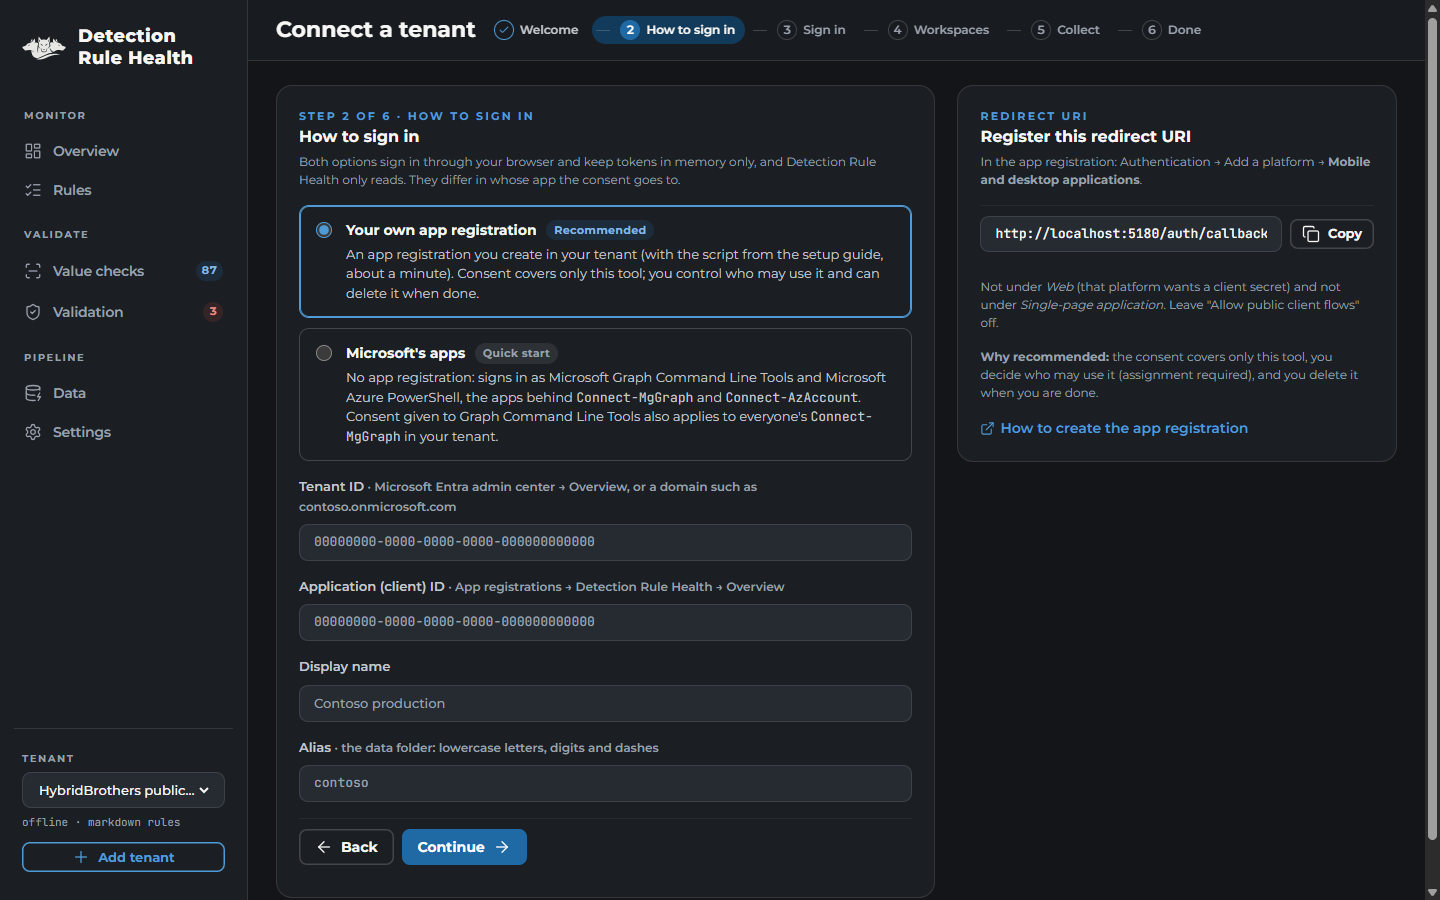
How to sign in
Choose one of two options; the setup guide compares them.
- Your own app registration (recommended). Consent applies to this tool only. Enter its
Application (client) ID. The wizard shows the redirect URI it must have:
http://localhost:5180/auth/callback. Don’t have one yet? See create the app registration. - Microsoft’s apps (quick start). No app registration: the app signs in as Microsoft Graph Command Line Tools and Microsoft Azure PowerShell, Microsoft’s public apps. Consent for the security permissions is then given to Graph Command Line Tools, so it also applies to everyone’s Graph PowerShell in your tenant.
Field Where to find it Tenant ID Entra admin center → Overview, or printed by the script. A domain such as contoso.onmicrosoft.comalso works; the wizard looks up the id.Application (client) ID own app registration only: App registrations → Detection Rule Health → Overview Display name Free text, for example Contoso production Alias Short name used for the data folder, for example contosoThere is no field for a secret, because none is needed in either option.
- Your own app registration (recommended). Consent applies to this tool only. Enter its
Application (client) ID. The wizard shows the redirect URI it must have:
-
Sign in
Sign in with Microsoft sends your browser to the Microsoft sign-in page of your tenant. Your normal sign-in policies apply: MFA, Conditional Access, account picker. Afterwards Microsoft sends you back to
localhost:5180and the app keeps the tokens in memory. With Microsoft’s apps there are two sign-ins in a row (Graph Command Line Tools, then Azure PowerShell); the second usually only asks you to pick your account.If Microsoft shows an error code such as
AADSTS50011, the app explains it; the full list is in troubleshooting. -
Workspaces
The app lists the subscriptions you can see and the Log Analytics workspaces with Microsoft Sentinel enabled. Select the ones to include. Defender XDR only? Choose No Sentinel workspace.
-
Collect
Choose how far back to read incidents (default 90 days) and start. You see each stage as it runs:
Stage Reads Microsoft Sentinel analytics rules rules of every selected workspace Defender XDR custom detections custom detection rules in Defender XDR Table schema tables and columns, to understand rule queries Incidents incidents and their classification in the chosen window Rule statistics calculated locally Value checks literal values extracted from every rule query, calculated locally A stage you lack permissions for is skipped with the reason; the others continue. A first collection usually takes a few minutes, depending on the number of rules and incidents.
-
Done
A summary of what was found, then Open overview.
After the first collection
- Overview shows rules, incidents and the classification split. Rates always come with their counts; rules with fewer than five classified incidents are greyed out. The noise map plots each rule’s volume against its noise: benign plus false positives as a share of its classified incidents. Rules above the threshold you set there (default 50 %) also appear under Needs attention.
-
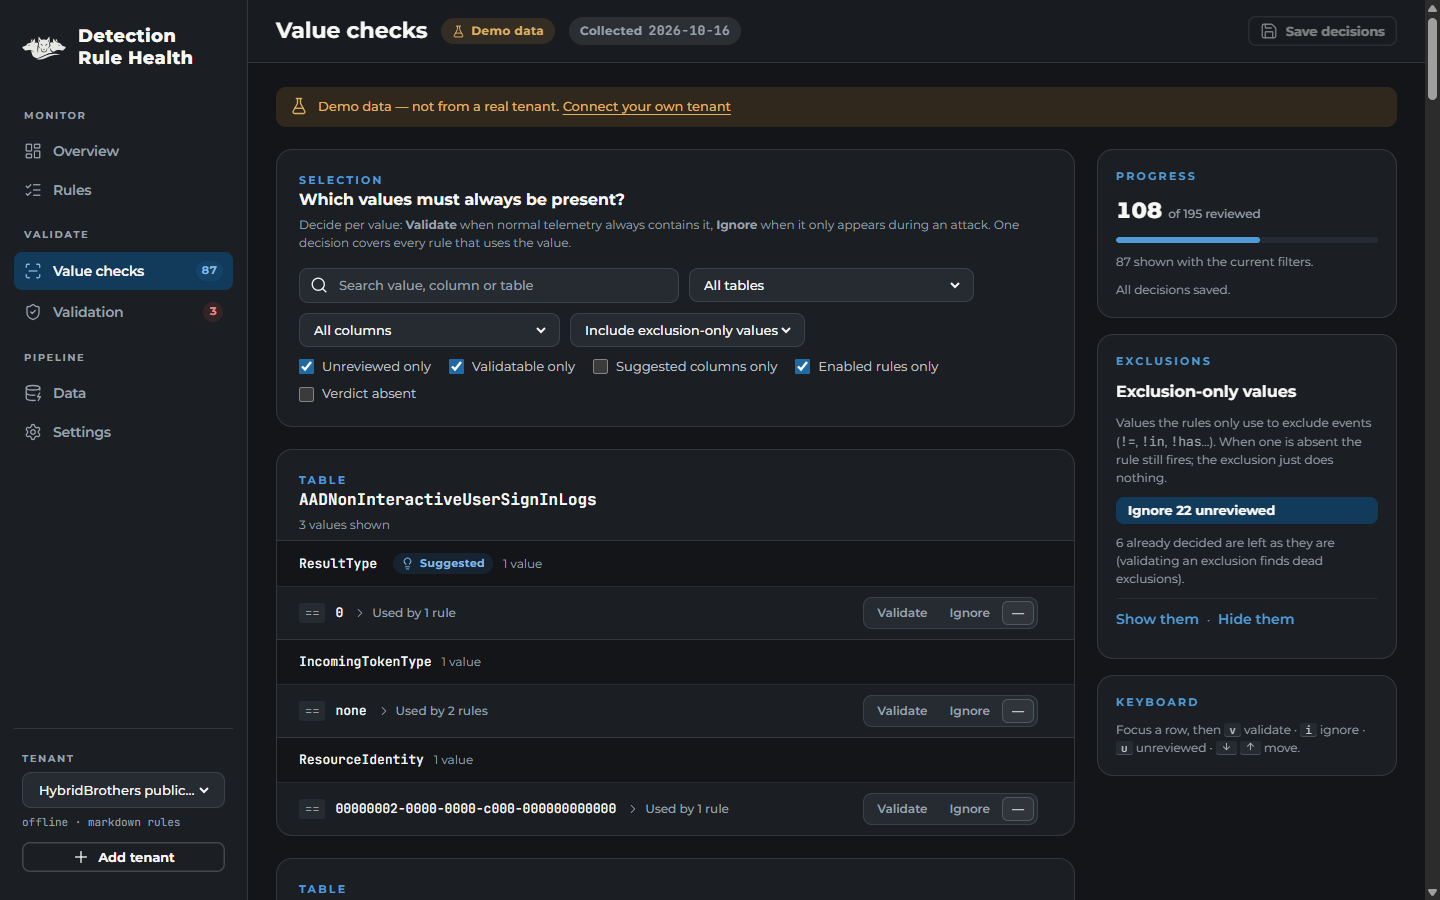
Value checks lists every value your rules compare against, grouped by table and column. Event-type columns such as
ActionTypeandOperationNameare marked Suggested; tick Suggested columns only to start with those. For each value, decide:- Validate — this value must occur in normal telemetry (for example
ActionType == "LogonFailed"inDeviceLogonEvents). - Ignore — this value only shows up when something bad happens, so its absence says nothing.
One decision covers every rule that uses the same value, and decisions survive new collections.
- Validate — this value must occur in normal telemetry (for example
- Save decisions, then Data → Run validation checks the values you marked against up to 30 days of your data. Data shows the exact queries first; reviewing them sends nothing. The Validation page then shows each value as present, absent, table empty (often a connector or retention problem) or error.
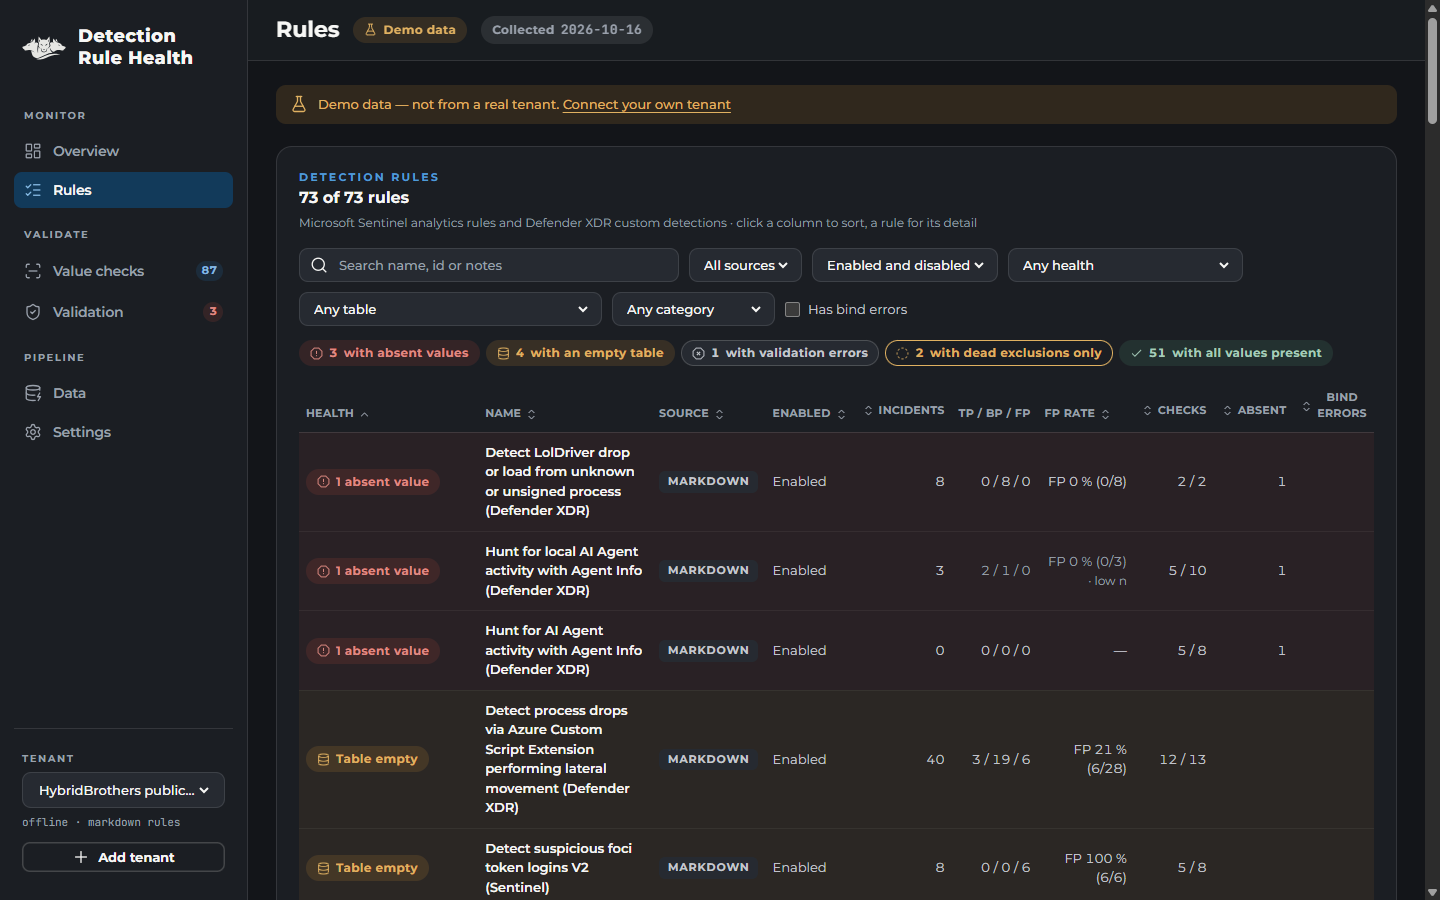
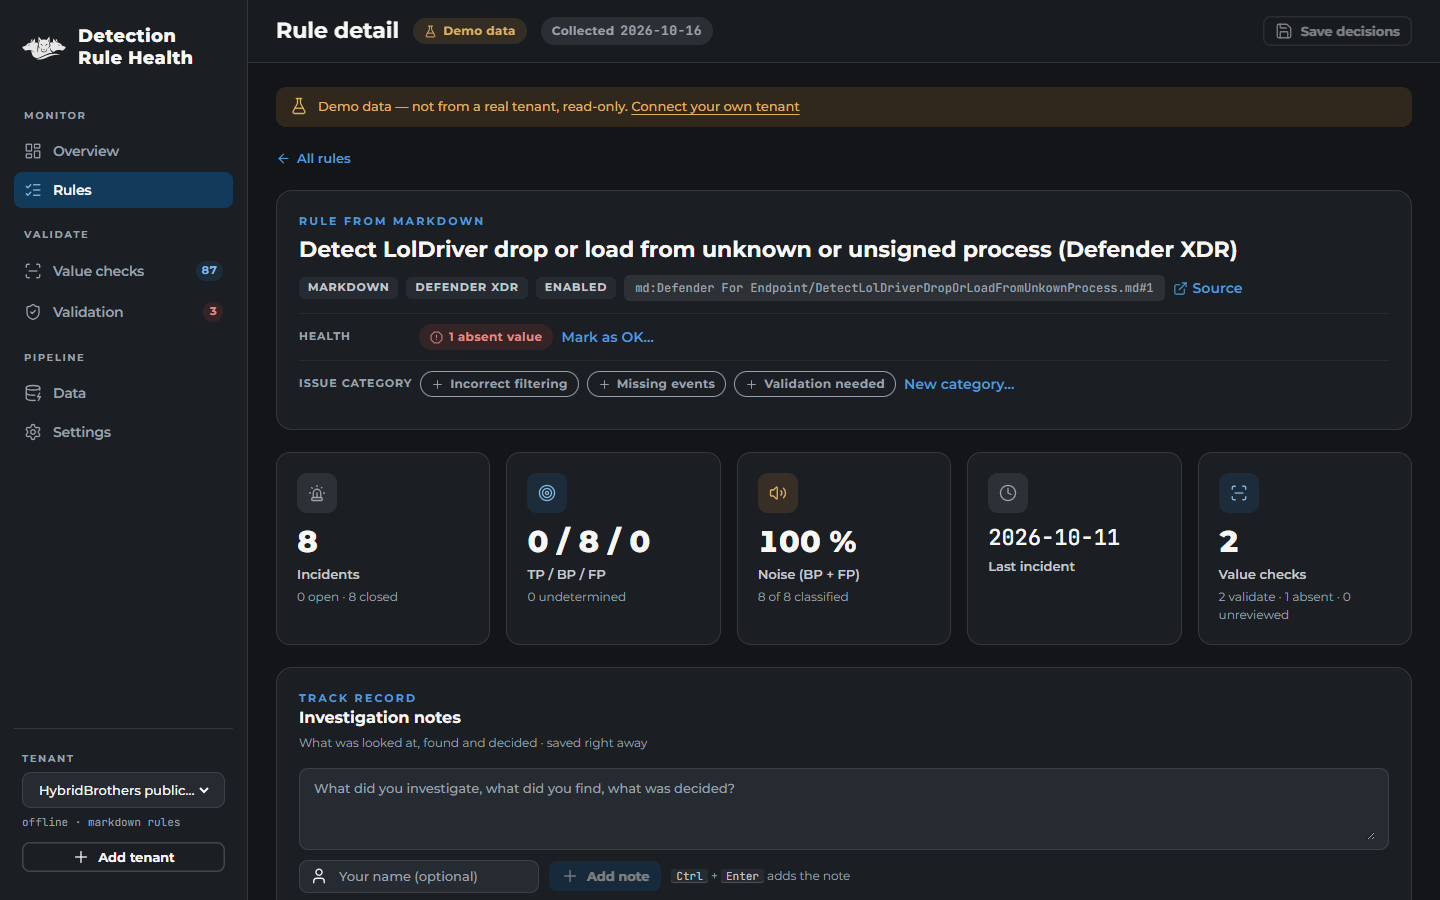
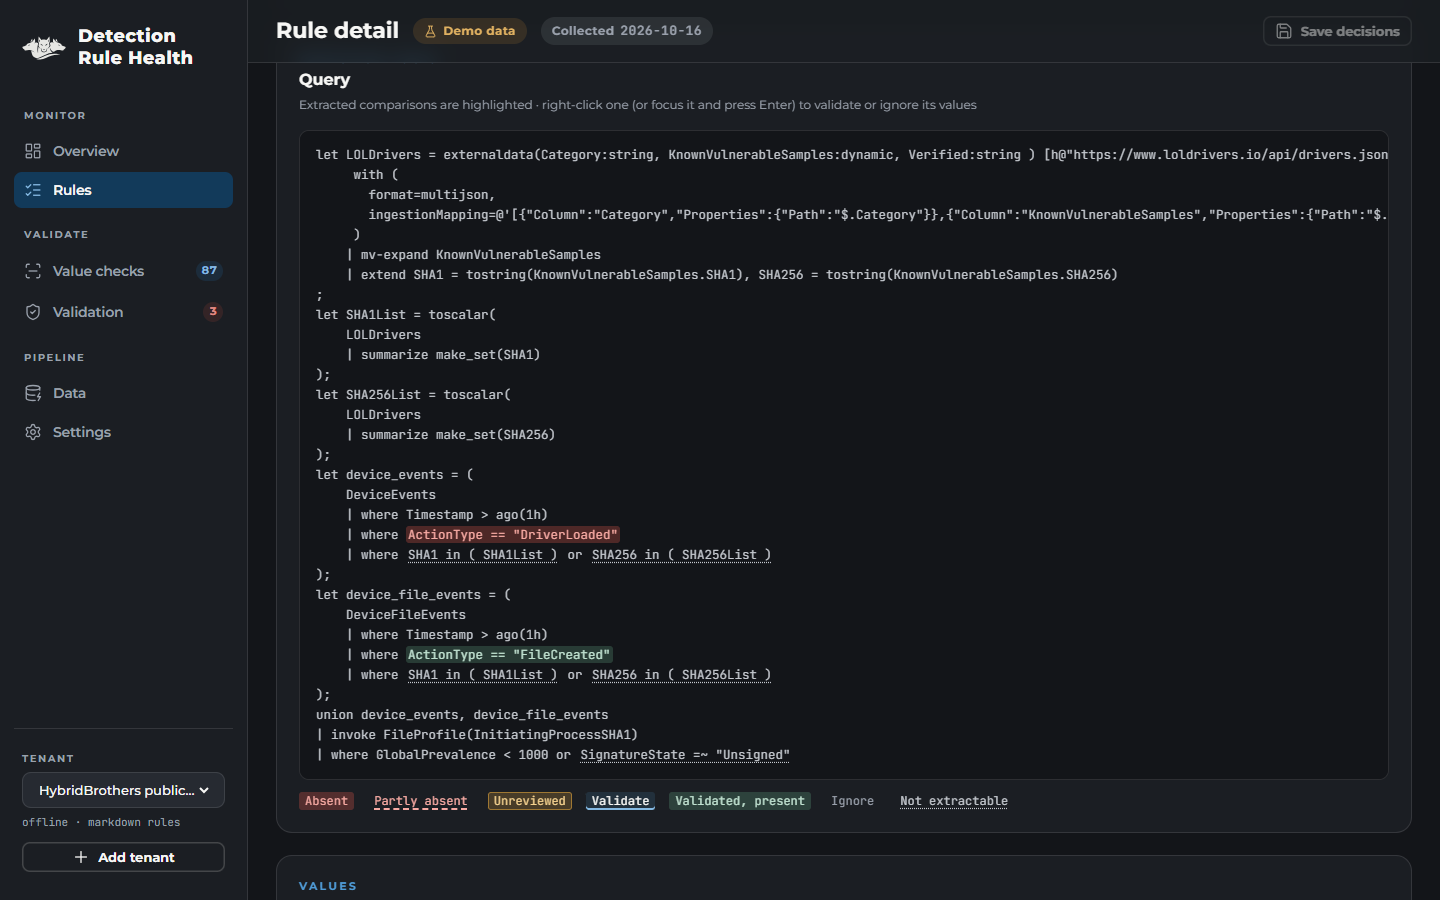
- Rules lists every rule with its health; click one for its detail. The query shows every extracted comparison highlighted with its state: red when a validated value was absent, green when it was present, dashed when only some values of a list occurred. Right-click a highlight to validate or ignore its values right there.
- Run Collect again from Settings whenever you want fresh numbers. The app does not run on a schedule.
After restarting the container you sign in again. Your collected data and decisions are still there; only the tokens are gone, by design.